

You're at the kitchen table with your laptop open, ready to type your Mandurah home's value into a property value growth calculator. Perhaps it's a house in Lakelands, a coastal property in Falcon, or a unit near Madora Bay. The temptation is obvious: enter one number, choose one growth rate and accept the projected future value as if it were a promise.
That's the wrong way to use the tool. A calculator can help you test possibilities, but it can't inspect your renovations, read the outlook from a Halls Head balcony or distinguish a well-presented home in Wannanup from an average dwelling nearby. In Mandurah, houses, units and lifestyle pockets can move at different speeds, so a single headline figure is rarely useful on its own.
Table of Contents
- What a Property Value Growth Calculator Actually Does
- The Inputs That Quietly Drive Every Result
- Running Real Scenarios in Lakelands and Madora Bay
- Why One Growth Rate Is Never Enough in Mandurah
- The Error Range Most Calculators Hide From You
- Reading the Output Like a Local Investor
- Pairing the Calculator With a Local Mandurah Appraisal
What a Property Value Growth Calculator Actually Does
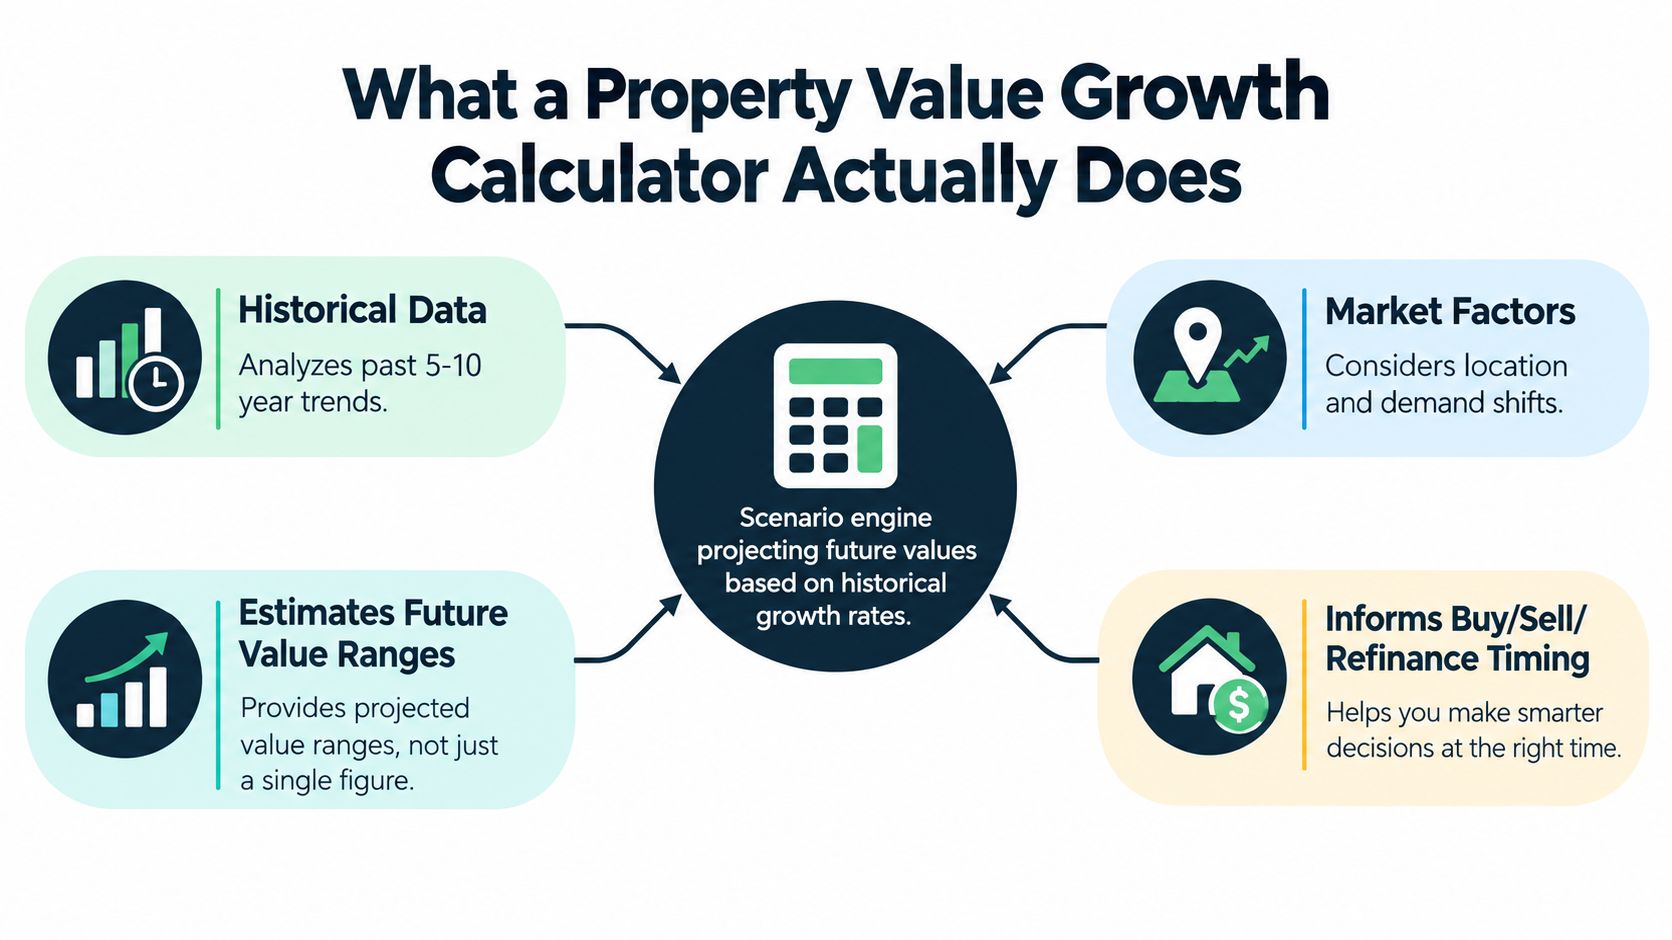
A property value growth calculator is a compound-growth engine presented in real estate language. You enter a current value, select an annual growth rate and choose a time horizon. The calculator then applies that rate repeatedly to estimate a possible future value.
The underlying formula is:
Future value = present value × (1 + growth rate)^years
That method matters because property growth compounds. The Reserve Bank of Australia says Australian housing prices have risen by about 7.25% per year over the past 30 years, with an average of around 7% during the long-run inflation-targeting period. At 7% annual growth, a property approximately doubles in a little over 10 years, although local markets can move very differently from that national history. The Reserve Bank's housing-price analysis provides useful context for choosing a long-term benchmark.
What the tool can't see
The calculator doesn't pull live Mandurah sales, inspect the home or understand why one property attracts stronger buyer competition than another. It won't know whether you own a renovated family home in Lakelands, a villa in Madora Bay, a waterfront property in Wannanup or an older dwelling in Dudley Park.
That's why I treat the result as a scenario, not a valuation. A $750,000 property growing at 7% annually reaches about $1.48 million after 10 years, according to the example used by an Australian capital-growth calculator. The compound-growth calculator methodology shows how quickly assumptions can shape the result.
Use the tool in three steps:
- Start with a credible current value, not an optimistic online estimate.
- Run conservative, base-case and optimistic rates separately.
- Compare each result with recent comparable sales and current competition.
For a proper explanation of how an estimate differs from a market valuation, see what property valuation means. The distinction is important before you use a projected figure to refinance, renovate or sell.
The Inputs That Quietly Drive Every Result
Most calculators look simple because they ask for only a handful of fields. Those fields still control the entire output. A weak starting value or an unrealistic growth rate can make a polished spreadsheet misleading.
Five fields deserve scrutiny
Current value comes first. Use a recent contract price, a properly supported appraisal or a recent comparable-sales assessment. Don't anchor the model to the highest automated estimate you can find. Online valuation models can miss renovations, condition, views, aspect, road noise and other property-specific influences, particularly where homes vary significantly.
Growth rate is the most powerful assumption. A calculator won't tell you whether your chosen rate suits a house in Halls Head, a unit in Madora Bay or a lifestyle property in Falcon. Small changes compound over time, so test a range rather than selecting a rate because it produces the future value you want.
Time horizon changes the meaning of the result. A shorter projection highlights current market conditions, while a longer projection magnifies the effect of the selected rate. I prefer testing several horizons, then checking whether the story still makes sense if the strongest growth arrives later.
Rental income belongs in an investment assessment, but it shouldn't be confused with capital growth. Rent can support holding costs and influence an investment decision, yet it doesn't automatically increase a home's resale value.
Fees and selling costs are often omitted. Agent fees, marketing, maintenance, transfer duty implications and tax considerations affect the money you retain, even when they don't appear in the future-value field. Read this guide to interest rates alongside your property assumptions when assessing borrowing and holding decisions.
| Calculator input | Typical Mandurah range | Effect on 10-year result |
|---|---|---|
| Current value | Use a verified property-specific figure | Affects every later calculation |
| Annual growth | Test multiple evidence-based scenarios | Compounds across the entire period |
| Time horizon | Compare shorter and longer holding periods | Exposes sensitivity to timing |
| Rental income | Use dwelling-specific rental evidence | Helps assess holding capacity |
| Fees and costs | Include costs relevant to the intended sale or hold | Converts a headline value into a more realistic outcome |
The order of entry isn't the issue. Honesty is. A calculator can process a guessed rate perfectly, but it can't make that rate credible.
Running Real Scenarios in Lakelands and Madora Bay
Two nearby properties can produce entirely different calculator results because dwelling type, suburb position and income profile matter. Averaging them together hides the decision that homeowners actually need to make.
Consider a four-bedroom, two-bathroom house in Lakelands purchased for $620,000. Using a 4.5% annual growth rate and no rental income, the projected value after 10 years is roughly $956,000. That's a useful planning scenario, but it isn't a promise about every Lakelands home. Presentation, land, street position, improvements and buyer demand will still determine the eventual market result.
Now compare a two-bedroom unit in Madora Bay bought for $410,000. Using a 2.8% annual growth rate, with rental income considered separately, produces a more restrained capital-growth story. The unit may still be an attractive hold if the rent supports the ownership costs, but its equity outcome shouldn't be judged against a family house using the same assumption.
| Scenario | Starting value | Annual growth | Rental income | 10-year projected value |
|---|---|---|---|---|
| Lakelands house | $620,000 | 4.5% | None included | Roughly $956,000 |
| Madora Bay unit | $410,000 | 2.8% | Included separately in the investment assessment | Calculate separately from capital growth |
The figures above are illustrative scenarios, not local sales evidence. They show why the model should be run by property type rather than by suburb name alone. A house and a unit can sit only a short drive apart while attracting different buyers, different rental demand and different resale competition.
Mandurah's recent evidence reinforces that point. REIWA reports 21.7% house sales-price growth for Mandurah and a $700,000 median sales price, while OpenAgent reports 16.1% house growth and 24.4% unit growth over the last 12 months. Those measures differ because their data and snapshot periods differ, but the gap itself is useful. REIWA's Mandurah suburb data should be read alongside a property-specific assessment, not substituted for one.
For more local context on how growth assumptions can differ inside the suburb, read the Lakelands property-growth analysis and then run your own house, unit or investment figures separately.
Why One Growth Rate Is Never Enough in Mandurah
Mandurah doesn't move as one uniform market. Lakelands family homes, Madora Bay units, Meadow Springs houses, Halls Head coastal properties, Falcon lifestyle homes, Wannanup waterfront dwellings and Dudley Park investments each face different buyer pools and competing stock.
The latest national and state data shows why local context matters. The Australian Bureau of Statistics reports that Australia's residential dwelling stock reached $12.3072 trillion in the December quarter 2025, increasing by $384.8 billion from the previous quarter, while the national mean dwelling price reached $1,074,700. In Western Australia, the mean price rose 16.8% year-on-year to about $1.01 million. The ABS dwelling-value release makes clear that state-level momentum can materially differ from national averages.
That doesn't mean you should paste WA's latest growth into your Mandurah calculator. Recent acceleration can be powerful, but it may not be sustainable across every future period. A long-run benchmark offers context, while suburb and dwelling evidence should shape the scenario range.
Use three rates, not one
I recommend this structure:
- Conservative: a restrained assumption that allows for slower demand, higher holding costs or a period of flat movement.
- Base case: a rate supported by comparable sales, the dwelling type and the property's position within its suburb.
- Optimistic: a stronger outcome reserved for scarce, well-presented or highly sought-after homes, not used as the default.
A local summary also shows why timing matters. SuburbTrends reports a $831,500 median house price for Mandurah over the 12 months to May 2026, a materially different result from other sources using different periods or methodologies. The Mandurah market summary is a reminder to ask what period and property sample sit behind any median.
Practical rule: If one growth rate is doing all the work, the model isn't testing your decision. It's defending it.
Use the Perth property-market forecast as background only. Your final assumptions should still be tied to the exact property, not a broad forecast.
The Error Range Most Calculators Hide From You
A calculator can produce a precise-looking answer from an imprecise starting point. That precision is cosmetic.
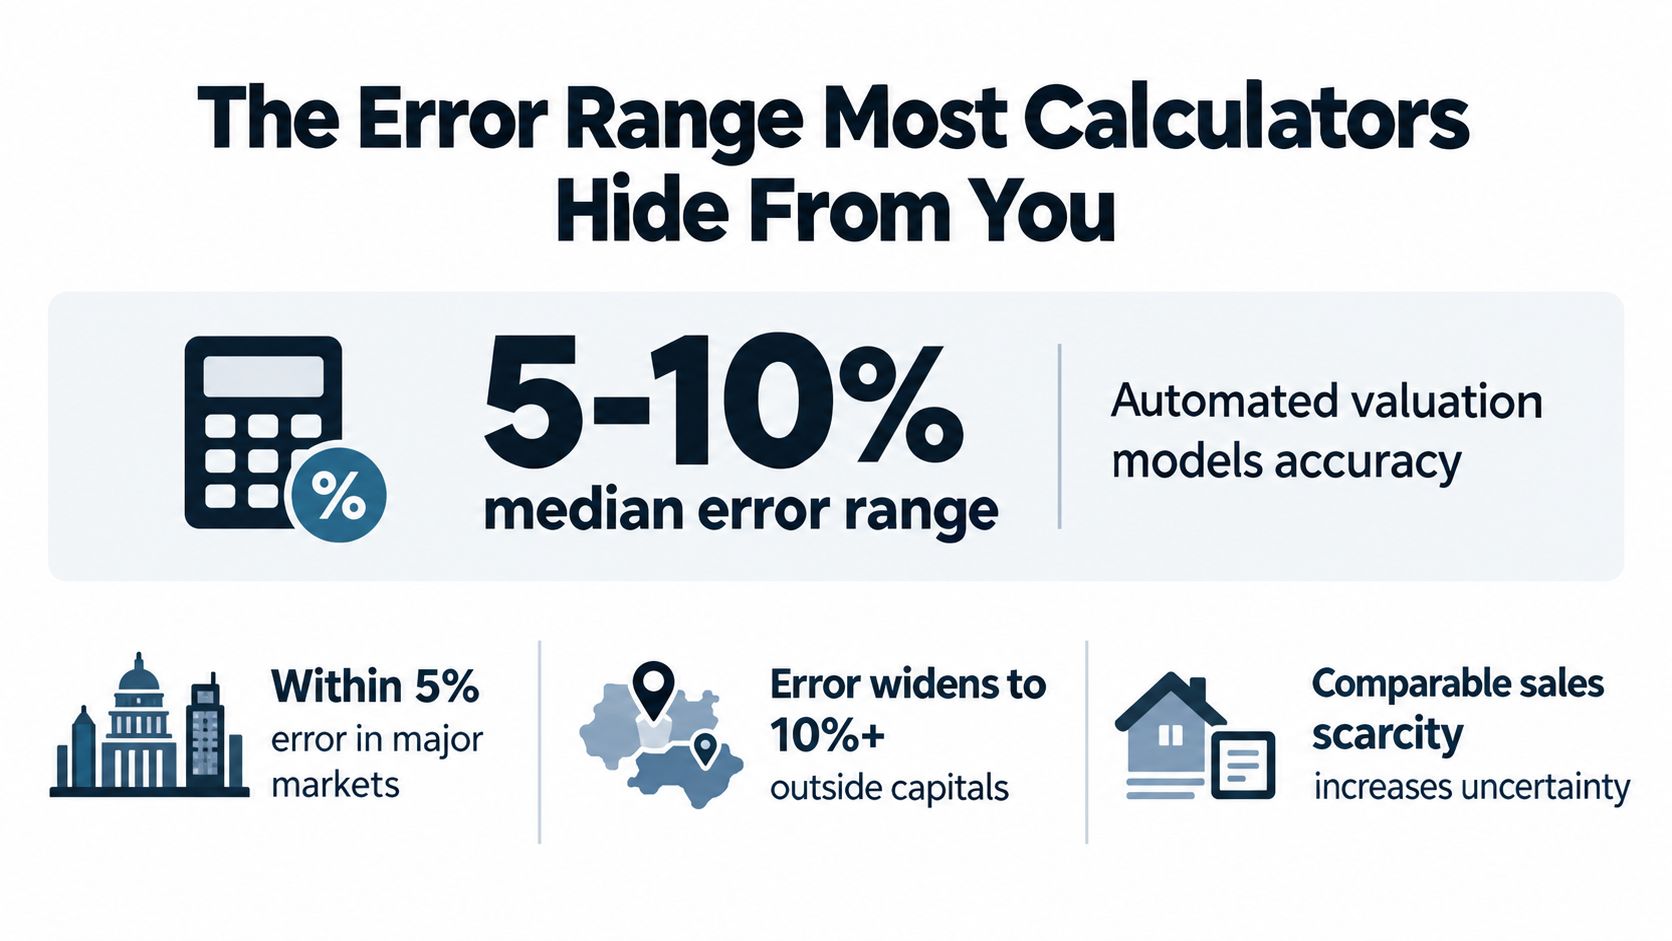
Australian automated valuation models can differ by tens of thousands of dollars because they don't physically inspect the home. One Australian property source notes that automated estimates often work better in high-volume, homogeneous suburbs and perform less reliably for unique properties, with median error rates often cited around 5% to 15%. On a $1 million property, that represents a possible $50,000 to $150,000 margin before you even add the uncertainty of future growth. The Australian AVM accuracy discussion explains why an online result should be treated cautiously.
Why coastal homes are especially sensitive
A calculator may recognise the suburb but miss the property's defining features. It won't reliably price the difference between a quiet street and a busy road, a renovated kitchen and an untouched interior, or water access and a merely nearby location. In Halls Head, Falcon and Wannanup, those distinctions can materially affect buyer interest.
The same issue applies to low-turnover or unusual homes. A large block in Dudley Park, a customised home in Meadow Springs or a distinctive coastal residence can sit outside the pattern that an averaged suburb model understands.
Renovations need discipline too. A kitchen upgrade is not automatically worth its construction cost at resale. The market pays for buyer appeal, quality and relevance, not just the amount shown on an invoice.
Check at least one comparable-sales set from the recent months before relying on the projection. If the suburb has limited turnover, unusual dwellings or rapidly changing demand, reduce confidence in the result. The calculator should produce a range for planning, never a final price for negotiation or refinancing.
Reading the Output Like a Local Investor
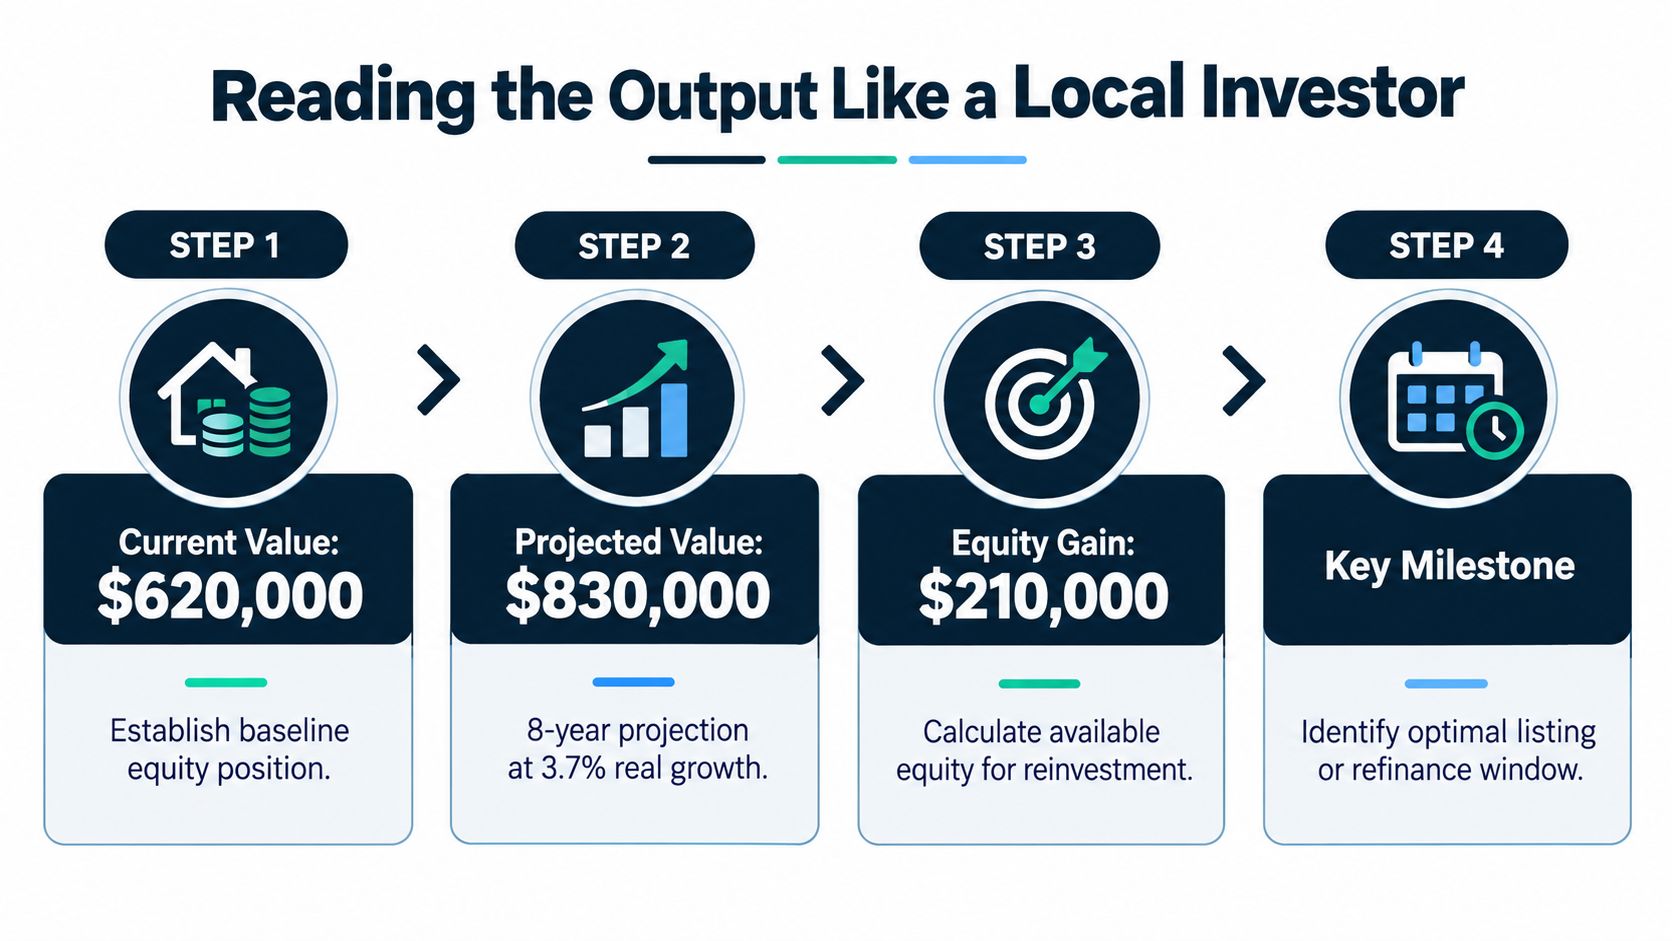
The projected value matters only when it helps you make a better decision. I read the result through three filters: equity, transaction consequences and timing.
Start with equity
Equity is the difference between the property's value and the debt secured against it. If the calculator suggests a meaningful increase, ask how much of that increase is genuinely usable after lending limits, selling costs and other obligations. A projected figure isn't the same as available borrowing capacity.
Then examine the next transaction
A rising value can change the cost of buying your next property. In Western Australia, transfer duty reaches a threshold at $725,001 and above, where the duty is $28,453 plus $5.15 for every $100, or part thereof, above $725,000. The WA duty scale referenced in this market data shows why a price increase can affect the buyer's total acquisition cost, even though the calculator itself may display only the property value.
The 2026–27 housing-taxation package also changed first-home buyer relief. The Western Australian Government package provides no duty on newly built or established homes valued up to $600,000, with concessional rates applying up to $800,000. The published Western Australian housing policy material is relevant to buyer affordability in Lakelands, Madora Bay and nearby suburbs.
Finally, ask whether waiting earns its keep
Compare the projected gain with maintenance, interest, insurance, vacancy and the opportunity cost of holding. If the result depends on a particularly strong assumption, test the conservative case before deciding to wait.
A useful output review asks:
- Equity: How much value may exist after debt is considered?
- Costs: What duty, selling and ownership costs could reduce the benefit?
- Timing: Does waiting improve your position, or just postpone a decision?
This video offers an additional visual explanation of the investment process:
Pairing the Calculator With a Local Mandurah Appraisal
A property value growth calculator gives you a framework. A local appraisal tests whether the starting point and the scenario still resemble the market.
That distinction matters before you list, refinance, renovate heavily or make an investment decision. An in-person appraisal can account for condition, street position, water outlook, land size, presentation and the comparable sales most relevant to the home. For a property in Lakelands, Madora Bay, Halls Head or Dudley Park, the useful evidence is usually close to the property and similar in type, not merely a suburb-wide average.
Use the two tools together
Run the calculator first, using conservative, base-case and optimistic assumptions. Then compare the starting value and projected logic with a local appraisal supported by recent comparable sales.
A practical appraisal process should consider:
- Physical condition: What buyers will see when they inspect.
- Micro-location: Noise, outlook, access, frontage and proximity to lifestyle features.
- Dwelling type: Whether the evidence relates to a house, unit, villa or distinctive coastal home.
- Current competition: How your property compares with homes buyers can purchase now.
- Likely buyer pool: Owner-occupiers, downsizers, investors or lifestyle purchasers.
Book an appraisal before listing, before committing to major renovations, when inheritance or separation creates a valuation need, or whenever your calculator result sits well outside recent suburb evidence. This explanation of in-person property appraisal in Mandurah shows why physical inspection adds context an automated model can't provide.
David Beshay Real Estate offers local property appraisals and sales guidance across Mandurah, including Lakelands, Madora Bay, Meadow Springs, Halls Head, Falcon, Wannanup and Dudley Park. Use the appraisal to refresh your starting value, rerun the scenarios and make the decision from evidence rather than optimism.
If you're considering a sale, refinance or renovation, David Beshay Real Estate can assess your home against relevant Mandurah comparable sales and help you interpret the calculator's scenarios. Visit David Beshay Real Estate to arrange a local appraisal and discuss the next practical step for your property.

